Summary:
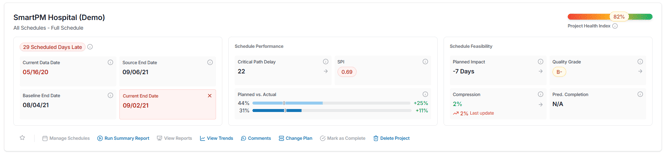
In Card View, your projects are displayed as individual cards that highlight key details at a glance. Each card includes important dates, schedule performance, and an up-to-date assessment of schedule feasibility based on the latest data date.
Important Dates:
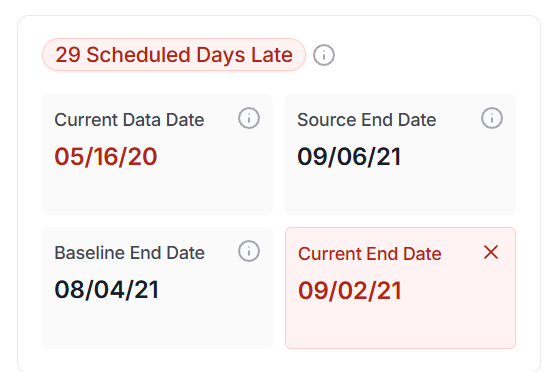
This section of the card highlights key schedule milestones and timing details, including:
- The number of days your project is ahead of or behind schedule
- Current data date: Representing the most recent schedule update (status date)
- Baseline end date: Based on the earliest schedule in the primary scenario
- Current end date: Reflecting the most recent project completion date as calculated by SmartPM
- Contractual end date: The date of the constraint on the tracked milestone or project finish date, this date can be edited manually in the Milestone Table
- Source end date: The finish date as defined in your original schedule file, taken directly from your CPM scheduling platform
Schedule Performance:
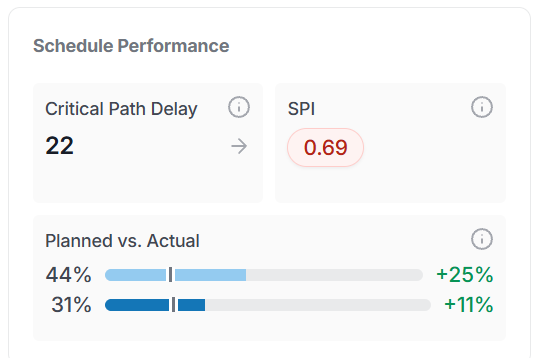
Schedule Performance provides insight into how your project is tracking against the plan:
- Critical Path Delay: The total amount of delay on the critical path based on progress reported to date.
- Schedule Performance Index (SPI): A measure of how efficiently the project is progressing compared to the plan. It reflects the actual rate of progress achieved versus what was planned.
- Planned vs. Actual Performance: A visual comparison of expected versus real progress. The top bar represents the planned performance, while the bottom bar shows the project’s actual performance.
- The percentages on the left represent total progress from 0% for both planned and actual values. The percentages on the right show progress made since the baseline was established, again for both planned and actual.
- The center line indicates the project’s status at the time the baseline was set.
- For example, if the planned total progress is 44% and the planned progress since the baseline is 25%, this means the project was at 19% completion when the baseline was established.
Schedule Feasibility:
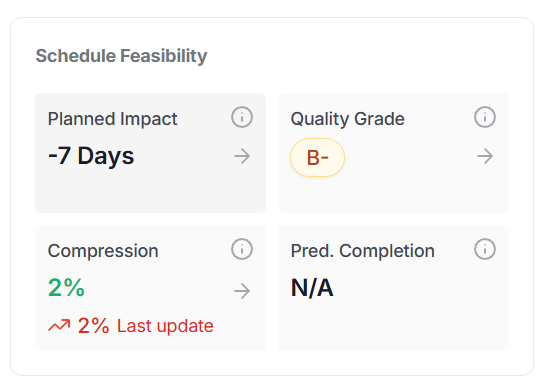
This section will show you the feasibility of your schedule including:
- Planned Impact: The total change to the project’s end date caused by updates to the planned schedule to date.
- Quality Grade: An assessment of the project schedule’s structural integrity, based on Critical Path Method (CPM) best practices.
- Compression: A comparison of the remaining effort in the current schedule versus the baseline schedule, indicating how much the schedule has been tightened or expanded.
- Predicted Completion: An estimated project completion date based on past performance. This value is available once the project has reached at least 50% completion.
Project Health Index:

The project health index is an overall measure of project risk, calculated using a weighted combination of the Schedule Quality Grade, Schedule Performance Index (SPI), and Schedule Compression Index.