SmartPM 2.0 introduces a modernized, more intuitive interface, while keeping all your projects, schedules, analytics, and permissions exactly as they were. This update focuses on simplifying navigation, organizing tools more logically, and giving you a more flexible way to view your portfolio.
What’s New (and What’s Not)
While SmartPM 2.0 brings a refreshed layout, the core of the platform remains unchanged.
Your data, including projects, schedules, analytics, user permissions, and metrics, is all exactly the same.
What has changed is how you move around the platform. SmartPM 2.0 introduces:
-
A streamlined, global navigation bar
-
A redesigned Projects page (formerly the Company Dashboard)
-
Clear top navigation inside each project
-
Reorganized spaces for schedules, reporting, modeling, and analytics
These updates make it easier to get where you need to go, faster.
Global Navigation Bar
The left-hand navigation bar is now your main menu. From here, you can access:
-
Dashboards
-
Projects
-
Reporting
-
Foreman
-
SmartPM Academy
-
Admin
-
Quick Actions
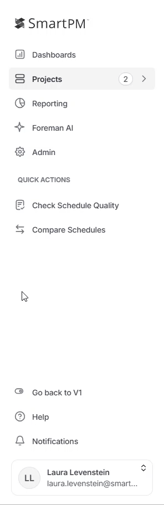
This replaces scattered menu items with one consistent, easy-to-scan navigation column.
Projects: Your New Home Base
The former Company Dashboard is now the Projects page.
This page provides a portfolio-wide view of every job, including familiar metrics such as:
-
Health
-
Schedule Quality
-
SPI
-
Compression
-
Critical Path Delay
-
And more
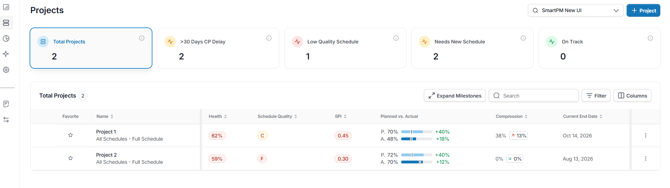
You can customize your Projects list by:
-
Favoriting a project to pin it to the top
-
Using Columns to show or hide the metrics that matter most
-
Using Filter or Search to narrow projects by name, sector, region, and other fields
-
Expanding Milestones for a quick look into phase-level details without leaving the page
Project-Level Navigation
When you enter a project, everything related to that job is now organized along the top:
-
Overview
-
Analysis
-
Gantt
-
Schedules
-
Modeling
-
Weather
-
Settings
-
Comments

This layout keeps project tools consolidated and easy to switch between.
Overview
The Overview tab gives you a snapshot of project health, including:
-
Health Score
-
Schedule Quality
-
SPI
-
Critical Path Delay
-
Compression
-
Predicted End Date
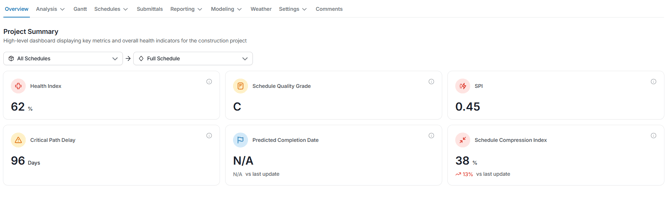
You can also toggle the view by milestone or model, allowing you to focus on the specific phase or scenario that matters most.
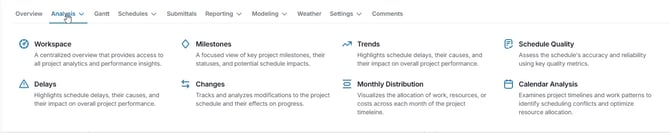
Analysis
The Analysis section groups all your analytics into a single hub.
Here you’ll find:
-
Project Workspace
-
Milestones
-
Delays
-
Trades
-
Schedule Quality
-
Trends and forecast indicators
If you're used to navigating between quality checks, trend dashboards, and delay analysis, this is where they now live.
Where Key Tools Moved
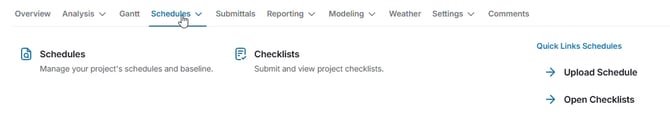
Schedules
The Schedules tab replaces the old Manage Schedules page.
Within Schedules, you can:
-
Upload new schedule files
-
View all versions for a project
-
Manage checklists tied to each update
-
Use the Rebaseline option with a new checkbox to simultaneously update your primary scenario
-
Filter for incomplete checklist items to speed up your review process
Reporting & Subscriptions
Reporting now has a clearer structure:
-
Portfolio-level reporting is accessed from the left navigation bar
-
Project-level reporting is available inside each project under the Reporting tab
The project-level list consolidates:
-
SmartPM template reports
-
Company reports
-
Project reports
-
Report subscriptions
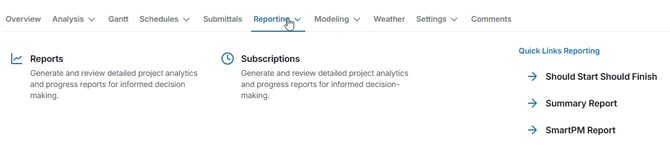
Use the Type column and favorites to keep important reports at the top.
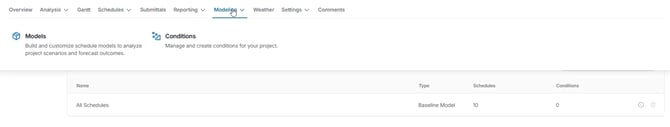
Modeling
Modeling is now its own top-level tab.
Within this section, you’ll find:
-
All models and conditions
-
Quick modeling shortcuts
-
Tools to build scenarios and compare results in one place
Additional Enhancements
SmartPM 2.0 also includes several workflow-friendly improvements:
-
Full-screen Gantt view with optional metric-row hide
-
Milestones tab for viewing milestone metrics in a clean table and setting the primary scenario directly
-
Comments moved into the main project navigation for better visibility
-
Enhanced Dashboards with more prominent Portfolio Quality insights, making it easier to spot issues with logic, constraints, or updates
To recap:
-
Your data, metrics, and analytics remain the same.
-
The new navigation makes SmartPM easier to move through.
-
Projects is your new home base.
-
Project-level organization is clearer and more intuitive.
-
Schedules, Reporting, and Modeling each have a more streamlined home.
If you need additional guidance, visit the SmartPM Help Center or contact your Customer Success Manager for a more detailed walkthrough.