The Trades section within the Analysis tab allows you to classify and analyze schedule activities by trade, giving you visibility into how each one is performing across a project. It uses SmartPM's AI-based LLM (SPML) to automatically assign activities to trades, even when schedules aren't set up with activity codes.
Setting up Trades is a three-part process: 1. enabling the feature in Configuration; 2. reviewing and adjusting trade mapping in project Settings; and 3. then viewing trade data in the Analysis tab.
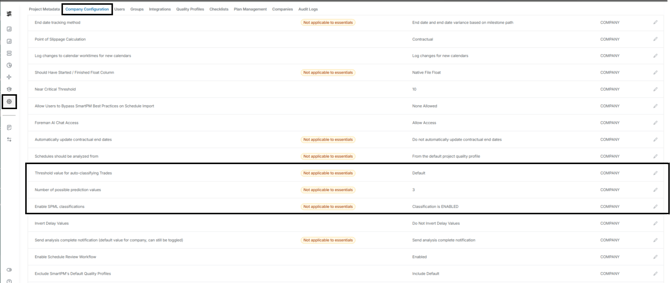
Step 1: Enable Trades in Configuration
This step is only needed if you want to use SPML . If you have set up activity codes, you can proceed to step 2.
To enable Trades:
- Click Admin
- Go to Company Configuration
- Scroll to the bottom of the page
- Click the pencil icon next to “Enable SPML Classification”
- Select Enable from the dropdown
- This activates SmartPM's AI to automatically classify schedule activities into trades based on activity names, WBS, or any activity codes added to the project.
**Important: Activity names, WBS, and activity codes must be in English for SmartPM's AI to classify them correctly.
- This activates SmartPM's AI to automatically classify schedule activities into trades based on activity names, WBS, or any activity codes added to the project.
- Configure the following additional settings:
- Threshold Value for auto-classifying Trades — Sets the minimum confidence level required for SmartPM's AI to automatically assign a trade to an activity. Activities that don't meet this threshold will not be auto-classified and will instead be flagged for manual review. .
- Number of possible prediction values — Defines how many trade suggestions SmartPM will offer for activities it cannot classify with sufficient confidence, giving you a shortlist of the most likely options to choose from. smartpm will suggest for the activities we can’t quite classify.
Note: After enabling SPML Classification, a schedule reimport or rebuild is required before classified trades will appear in the project.
Step 2: Review & Adjust Trade Mapping
Once the feature is enabled, users can review how SmartPM classified activities and make corrections if needed. This is done in the project's Settings.
To access Trade Mapping:
- Open the project
- Go to Settings
- Select “Trade Mapping”
Reviewing classifications
The Trades tab displays all activities and the trade SmartPM assigned to each. If a classification is incorrect, you can update it.
To reassign a classified activity:
- Select the activity or activities you want to update
- Click Bulk Edit
- Assign the correct trade
Unclassified activities
Activities that SmartPM was unable to classify appear under the Unclassified Activities tab. You can manually assign a trade to these activities using the same edit process above.

Changing the activity code used for mapping
If your project has activity codes set up, SmartPM may be using AI classification by default. If you'd prefer to map trades using a specific activity code instead, you can change this in the ChangeTrade Mapping option.
This is useful when one of your existing activity codes is already designating trade, and you want SmartPM to reference that instead of the AI classification.
Step 3: View Trades in the Analysis Tab
Once trade mapping is complete, trade data is available in the Analysis tab.
To view Trades:
- Go to the Analysis tab
- Select Trades
Once within the Trades tab, there are four charts you can view:
- Trade Criticality - View your trades grouped by criticality level, determined by the activity with the lowest float within each trade.

- Trade Criticality Distribution - Building on Trade Criticality, this chart adds activity count as a visual dimension: the size of each card reflects the number of activities in that trade, so you can instantly compare trade size alongside criticality in a single view. Clicking any card takes you directly to that trade's details page.

- Activity Look Ahead - See which trades have work scheduled in the next 3 or 6 weeks, viewable in either Gantt or list format. Expand or collapse any trade to explore the individual activities falling within the selected window.

- Trades - A complete list of all trades in the project, surfacing key metrics such as float and finish variance at a glance. Click the arrow on any trade to drill down and explore its details.

Click a trade from the charts to be brought to a Trade Details page which includes the following data:
- Activity Look Ahead - A focused lookahead scoped to the selected trade or trades. Click the “Expand All” button to expand or collapse trades and explore their individual activities within the selected window.

- Dependency Map - Visualize all predecessors and successors of the selected trades. Clicking any trade in this view adds it to the overall analysis, making it easy to broaden your scope as you explore dependencies.
- The thickness and color of each predecessor/successor connecting line reflect the number of trades and their criticality based on lowest float, giving you an immediate sense of where the heaviest dependencies lie.

- Trade Predecessors & Trade Successors
Visualize all predecessors and successors of the selected trades in a heat map. Clicking any trade in this view adds it to the overall analysis, making it easy to broaden your scope as you explore dependencies. The bigger the block, the more activities are included.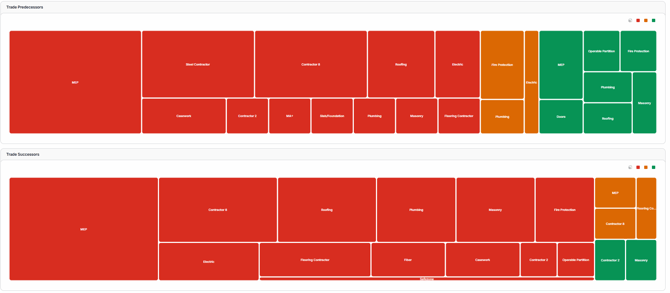
- Schedule Performance Index (SPI) - Measures how efficiently the selected trade is progressing relative to the baseline schedule. Calculated as the trade's actual progress divided by its planned progress, the SPI shows whether that trade is ahead of, on track with, or behind its originally planned work. An SPI of 1.0 means the trade is exactly on schedule; below 1.0 indicates the trade is running behind; above 1.0 means it is ahead of plan.

- Trade Density - Understand the level of concurrency across trade activities in your project. Color coding ranges from green at low concurrency up to red at the highest concentration points. Start with a yearly overview and drill all the way down to individual days. Use this chart to identify when better crew logic is needed or when additional crews should be deployed to meet a deadline. Clicking on any day opens the Gantt chart at that specific date.

- Monthly Distribution- Shows the number of activities within the selected trade starting and finishing in each month across the project timeline. Use this to understand the trade's work pacing, identify workload concentrations, and assess whether activities are appropriately spread over time or bunched in ways that may create risk.

- Window Start Accuracy - Tracks how closely the trade's activities start within their scheduled update window over successive schedule updates. Higher accuracy indicates the trade is consistently initiating work as planned; lower accuracy flags recurring early or late starts that may signal sequencing or crew availability issues.

- Window Finish Accuracy - Tracks how closely the trade's activities finish within their scheduled update window over time. Maintaining high accuracy for a trade ensures its completion dates align with the plan and reduces downstream risk to dependent trades and the overall project end date.

- Schedule Changes over time - Visualizes the frequency and types of schedule changes, such as activity additions, logic modifications, or duration adjustments, made to the selected trade's activities across project updates. Use this chart to spot trades whose scope or sequencing is frequently shifting, which may indicate planning instability or coordination challenges.

- Average Start Variance - Shows how far in advance or behind schedule the trade's activities are starting on average, measured across updates. A consistently positive or negative variance for a trade can reveal systemic early or late mobilization patterns that affect coordination with other trades.

- Planned vs. Actual Percent complete - Compares the trade's baseline planned progress against actual progress achieved across schedule updates. This chart makes it easy to see at a glance whether a trade is delivering work at the pace the original plan required, or whether a gap is opening that needs to be addressed.

- Earned Baseline Days - Reflects the number of baseline-scheduled days the trade has effectively "earned" through completed work, compared to what was planned by the current data date. This helps quantify whether the trade is keeping pace with the original schedule or falling short of its committed productivity.

- Activity list - A complete list of all activities assigned to the selected trade, allowing you to review individual activity details, float values, and status directly from the Trade Details page.
