The Project List in SmartPM gives you a high-level view of all the projects within your SmartPM account. It consolidates project-level data into one central location, making it easy to track overall portfolio health, schedule quality, and performance trends across the organization. This dashboard is designed to help executives, schedulers, and project teams monitor how projects are performing at a company level and quickly identify risks or areas that need attention.
To update your default view, visit your user profile settings.
Key Features on the Project List:
- Displays portfolio-wide metrics such as total number of projects, average project health, schedule quality grades, and schedule performance indicators
- Includes filters that allow you to narrow down results by project attributes or timeframes
- Customize the columns you want to view for each project
- Easily locate inactive files by selecting the All Projects tab and applying the Slot Type: Inactive filter

- Filter to view Milestones within the Project List for a smoother experience.
- Export your entire Project List to an excel file for easy review (only available in table view)

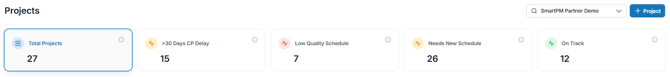
At the top of the Project List, you’ll see a portfolio overview that summarizes all projects. This includes counts of projects that are delayed, low quality, require new schedules, or are on track. Clicking any metric filters the project list to show only those projects.
You are also able to search for specific projects and filter the list to focus on specific projects by using the Search and Filter function.
Within the Project List, you can see a high level overview of each project. You are able to favorite a project by clicking the star to the left of the project. You can add or remove metric columns based on what you would like to view for each project. There are over 100 columns to choose from. Depending on how your schedule is loaded, some of the metrics won’t be available to add (cost/resource). To view available columns, click here.
Viewing and Managing Milestones
To display milestones across all projects, click Expand Milestones at the top of the project list view. This action will update the display of your Project List to include Key milestones beneath each project so you can easily access milestone information.
You can also add a dedicated Milestones column when customizing your columns.
Contact the support team to share a customized project list view with your team.
Column Options
To access all of the column options, click the ‘columns’ button on the top right of the project list. From here, you can select from the available columns and visible columns to determine which metrics should be visible on the Project Card. You can also dictate the order by dragging and dropping the metrics in the visible column.
The default columns for each project card will include:
|
Health |
Project Health is calculated by a combination of other project metrics. It adjusts over time, and it adds importance of various metrics at different points in time based on earned value |
|
Planned vs. Actual |
Planned progress refers to where the schedule expects you to be at a given point, whereas actual progress measures where the project really is today. |
|
Compression |
Compression as a metric of how much will need to be done for the remaining duration of the job compared to the work originally planned. |
|
Schedule Quality |
The schedule quality grade is an indicator of the feasibility of the schedule and is derived from the schedule quality profile metrics and how closely the schedule adheres to the standards. |
|
SPI |
The Schedule Performance Index (SPI) is your actual progress over your planned progress. Plan progress is calculated from the baseline and actual progress is calculated from the most recent update. |
|
Current End Date |
This date is based on the latest projected date. If all Activities have been completed, it will be based on the last actual date. |
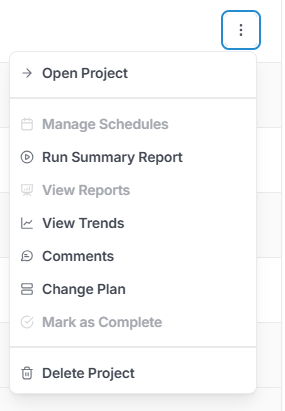
Project Menu
To the right of the project, click the ellipses to access the project menu.
|
Open Project |
Open the Project to review deeper insights including analysis, gantt charts, and reporting. |
|
Manage Schedules |
Upload your project schedule after updates or rebaseline your schedule. |
|
Run Summary Report |
Generate a concise project summary report in seconds, delivering a clear snapshot of critical metrics, milestone status, and overall progress. |
|
View Reports |
Clicking the reports icon will bring you to the intended project Reports tool |
|
View Trends |
Track how your project’s key metrics change over time. Highlight patterns and shifts across updates to see if performance is improving, declining, or staying stable. |
|
Comments |
Leave a comment or view other comments created on a project. |
|
Change Plan |
This allows users to upgrade their projects to different slot types that are available for that company. |
|
Mark as Active/Complete |
Quickly mark a project as complete which will remove the project from the metrics in the executive dashboard but the project will remain functional in the slot type its assigned to, change it back to active if you want the metrics to be included again |
|
Delete Project |
Remove a Project from your project list. This action is irreversible. |