Select a project title from the Project list to open the Project page. Here, you can explore all aspects of the project for a complete view of its status and progress.
You will be brought to the Overview tab within your Project and see all of the Core Analytics that are also accessible from the Project List.
Across the top of the Project Page, you will see tabs that allow you to navigate to different aspect of your project. Hover over tabs with dropdown arrows to quickly access areas on the Project Page.
|
Overview |
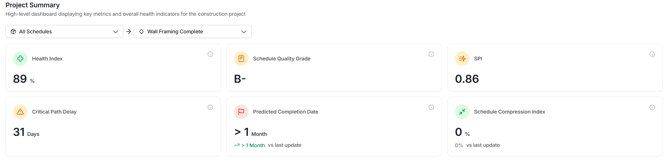
High-level dashboard displaying key metrics and overall health indicators for the construction project. |
|
Review a centralized overview that provides access to all project analytics and performance insights. |
|
|
Use the Gantt Chart to see your schedules and quickly drill down into the activity details to see missing logic and activity metrics. |
|
|
Manage your project’s schedules and baseline. Create checklists for each schedule update to ensure best practices are followed and nothing is missed. |
|
|
Submittals |
Manage, track, and respond to Submittals to keep project documentation clear and timely. |
|
Manage, track, and respond to Requests For information to keep project communication clear and timely. |
|
|
Generate and review detailed project analytics and progress reports for informed decision making. Automate delivery of reports at specific times to specific audiences with subscriptions. |
|
|
Build and customize schedule models to analyse project scenarios and forecast outcomes. |
|
|
View historical weather patterns based on location. |
|
|
Manage general info about your project including metadata, users, groups, WBS, calendars, and trades. |
|
|
Leave a comment, ask for clarification, start a discussion about this project. |